Image Details
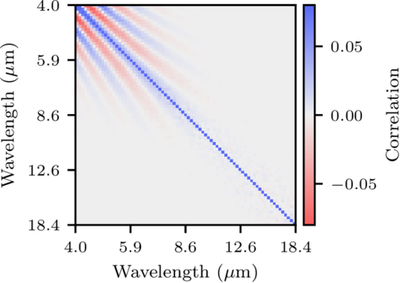
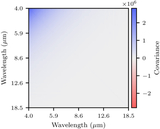
Caption: Figure 12.
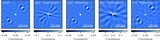
Illustrative example of the correlation matrix corresponding to the covariance matrix defined in Equation(35), averaged over 100 runs. The color map is capped at ±0.08, to increase the visibility of the smaller features. This pattern is similar to the covariance of the planetary signal as shown in Figure 4 (top).
Other Images in This Article
Show More
Copyright and Terms & Conditions
© 2025. The Author(s). Published by the American Astronomical Society.
Copyright ©
2025 Astronomy Image Explorer. All Rights Reserved.