Image Details
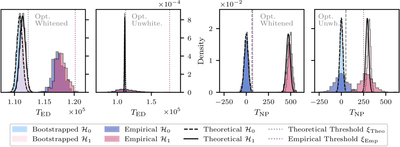
Caption: Figure 9.
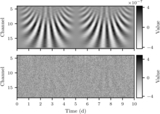
Distribution of the test statistics, T ED (left two plots) and T NP (right two plots), under the null hypothesis, ﹩{{ \mathcal H }}_{0}﹩, and alternative hypothesis, ﹩{{ \mathcal H }}_{1}﹩, for the optimistic scenario with and without whitening. A P FA = 0.00135 corresponding to a 3σ detection is assumed. The empirical results are calculated for a sample of 500 simulated observations of our target system. The bootstrapped results are sampled from a multivariate normal distribution following the considered instrumental error covariance, Σ ref.
Other Images in This Article
Show More
Copyright and Terms & Conditions
© 2025. The Author(s). Published by the American Astronomical Society.
Copyright ©
2025 Astronomy Image Explorer. All Rights Reserved.