Image Details
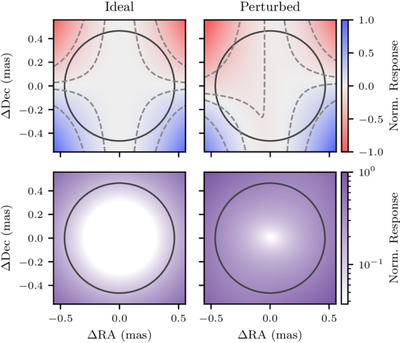
Caption: Figure 5.
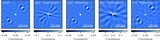
Intensity response within the angular extent of the star (dark gray circle) for an ideal (left) and a perturbed (right) instrument using the values from Table 1, and optimistic perturbation levels of rms(δA k ) = 0.1%, rms(δp k ) ≈ 1.5 nm, and rms(δθ k ) = 0.001 rad (see Section 4). Top: response at a given instance in time. Whereas the null of the ideal instrument is broad and symmetric, the perturbed instrument shows asymmetries, indicated by contours in light gray dashed lines. Bottom: rms of the response over a full rotation of the array. While the ideal response shows a substantial suppression within the extent of the stellar disk, the suppression is much smaller in the perturbed response, explaining the increase in stellar leakage.
Other Images in This Article
Show More
Copyright and Terms & Conditions
© 2025. The Author(s). Published by the American Astronomical Society.