Image Details
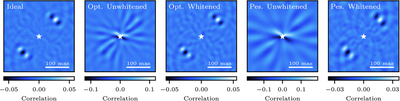
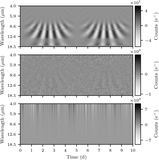
Caption: Figure 8.
Correlation maps showing the correlation of the data with the planetary templates, y ﹩{}^{T}{{\bf{x}}}_{I}/\sqrt{{{\bf{x}}}_{I}^{T}{{\bf{x}}}_{I}}﹩, where x I describes a model with a unit SED. The ideal scenario shows the clearest sign of the planet in the upper right corner. The maps based on unwhitened data show strong artifacts and no longer allow for a detection of the planet in the map. The capability to locate the planet at its correct position is improved significantly for the whitened scenarios.
Other Images in This Article
Show More
Copyright and Terms & Conditions
© 2025. The Author(s). Published by the American Astronomical Society.
Copyright ©
2025 Astronomy Image Explorer. All Rights Reserved.