Image Details
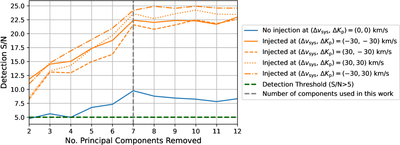
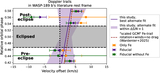
Caption: Figure 12.
Detection S/N as a function of number of removed principal components. The blue line shows the detection S/N for the observed data without model injection, while the orange lines show the injected data for four different velocity offsets. The dashed green line indicates a detection threshold of S/N > 5.
Other Images in This Article
Show More
Copyright and Terms & Conditions
© 2025. The Author(s). Published by the American Astronomical Society.
Copyright ©
2025 Astronomy Image Explorer. All Rights Reserved.