Image Details
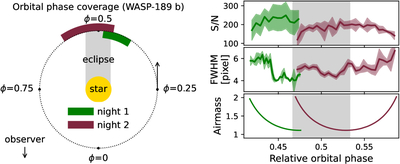
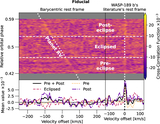
Caption: Figure 1.
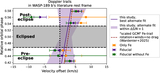
Left panel: phase coverage of WASP-189 b’s orbit during our two observing nights. The orbit of WASP-189 b is shown face-on (dotted black line), with the observer’s direction indicated. Relative orbital phases (ϕ) are annotated along quarterly intervals. The first (green) and second (wine red) nights cover the pre-eclipse and post-eclipse phases. Both nights cover (part of) the secondary eclipse. Right panel: time series of three observables: the signal-to-noise rate per frame pair (S/N), FWHM of the trace on the detector (in pixels), and airmass are shown. The same colors as in the left panel are used to indicate each night. The time series has been binned (10 frames per bin), and the standard deviation of each bin is plotted as the shaded region.
Other Images in This Article
Show More
Copyright and Terms & Conditions
© 2025. The Author(s). Published by the American Astronomical Society.