Image Details
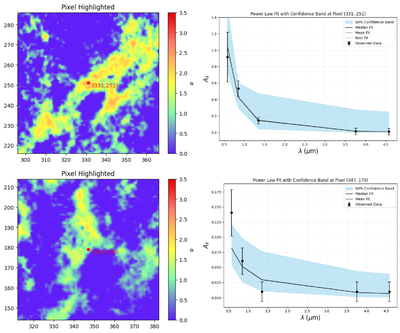
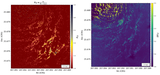
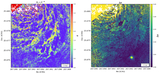
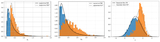
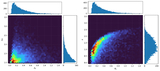
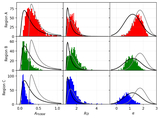
Caption: Figure 10.
Selected pixels inside a dense area in Region A (top two panels) and a diffuse area in Region B (bottom two panels). The α means from Monte Carlo resampling, with the labeled pixel and pixel number in red, is shown on the left column, while the power-law fit is shown on the right. The mean and median of the Monte Carlo simulated distributions are given as the solid and dotted lines, respectively. The 68% confidence band of the Monte Carlo distribution is shown in blue.
Other Images in This Article
Show More
Copyright and Terms & Conditions
© 2025. The Author(s). Published by the American Astronomical Society.
Copyright ©
2026 Astronomy Image Explorer. All Rights Reserved.