Image Details
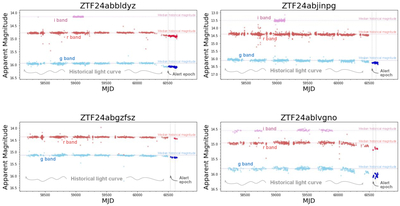
Caption: Figure 8.
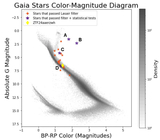
Light curves are plotted for all four objects that passed both sets of filters within and beyond the brokers on the night of 2024 November 24. Left to right and top to bottom, we have ZTF24abbldyz, ZTF24abjinpg, ZTF24abgzfsz, and ZTF24ablvgno. Figure 7 shows these objects plotted on a color–magnitude diagram as points A, B, C, and D, respectively. As in Figure 4, the data plotted are an amalgamation of historical data pulled from the ZTF archive and alert-packet data pulled with the Lasair API query. I-band, R-band, and G-band data are shown in purple, red, and blue, respectively. Note that I-band data are the least represented of the three bands, thus we primarily use R-band and G-band data to draw conclusions about the objects’ behavior. All other plot features are the same as in Figure 4. It can be observed in all four light curves that the alert-packet data are fainter than the historical data, indicating a dip in brightness. ZTF24abbldyz shows a gradual dip in brightness beginning well before the alert epoch (≈250 days earlier) and continuing until the most recent data. Despite having noisier data, ZTF24ablvgno shows a clear dip in brightness beginning roughly 500 days before the alert epoch.
Other Images in This Article


Copyright and Terms & Conditions
© 2025. The Author(s). Published by the American Astronomical Society.