Image Details
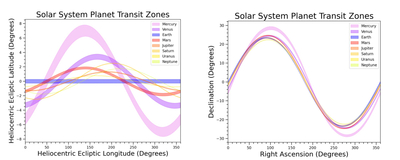
Caption: Figure 2.
Transit zones for all solar system planets are plotted in heliocentric ecliptic coordinates (left) and in celestial coordinates (right). Each planet’s transit zone is shown as a colored sinusoidal band. Sensors located in the colored regions of sky could detect the corresponding planets as they transit the Sun. Overlaps between colored bands indicate regions where multiple planets could be detected. Note there are 28 regions of overlap between sets of two planet transit zones and eight regions of overlap for sets of three planets. We adapt code from R. Wells et al. (2018) and use the updated transit zone geometry (Figure 1) to calculate and plot the full transit zone angles as ϕTZ = ﹩2\arcsin (({R}_{\odot }-{R}_{{\rm{p}}})/r)﹩.
Other Images in This Article


Copyright and Terms & Conditions
© 2025. The Author(s). Published by the American Astronomical Society.