Image Details
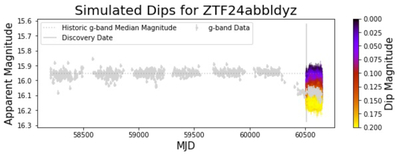
Caption: Figure 5.
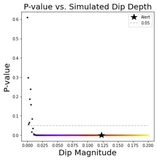
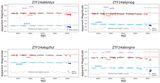
Simulated dips of varying amplitudes are plotted along with g-band data from ZTF24abbldyz. Simulated dips are plotted in color, where each color indicates a different amplitude. Real data for ZTF24abbldyz are plotted in gray scale. The horizontal dotted line indicates the median magnitude of historical g-band for ZTF24abbldyz data at least 100 days older than the object’s discovery date in Lasair. The solid vertical line marks this discovery date, and gray points plotted to the right of the line are included in the object’s ZTF alert packet. We plot simulated dips in 0.01 mag increments ranging from 0 to 0.2 mag. We use our simulated data to perform the two-sample K-S test and investigate how the p-value depends on the dip amplitude.
Other Images in This Article


Copyright and Terms & Conditions
© 2025. The Author(s). Published by the American Astronomical Society.