Image Details
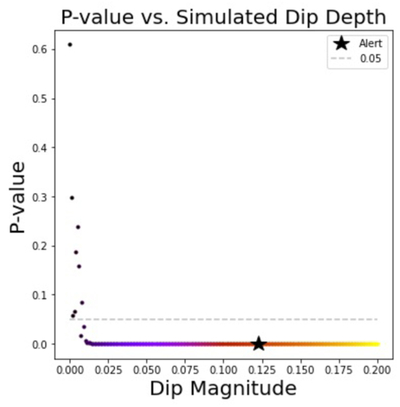
Caption: Figure 6.
p-value from the two-sample K-S test is plotted against simulated dip depth for ZTF24abbldyz, where the color corresponds to dip magnitude as in Figure 5. The horizontal red line indicates a p-value of 0.05, the cutoff for our two-sample K-S test with a 95% confidence interval. The p-value for the actual alert data is starred. As expected, the p-value decreases with dip amplitude and the relationship appears exponential. The 0.05 p-value cutoff successfully eliminates candidates with dip amplitudes close to zero and recognizes dip amplitudes greater than about 0.01 mag as statistically significant.
Other Images in This Article


Copyright and Terms & Conditions
© 2025. The Author(s). Published by the American Astronomical Society.
Copyright ©
2025 Astronomy Image Explorer. All Rights Reserved.