Image Details
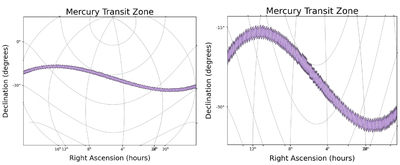
Caption: Figure 3.
MOC map for the Mercury transit zone is plotted in purple with a HEALPix cell resolution of 12. The plot is a projection of the world coordinate system to the pixel image coordinate system. The right-hand plot more clearly shows the jagged edge of the MOC rendering, which slightly overestimates the total transit zone region.
Other Images in This Article


Copyright and Terms & Conditions
© 2025. The Author(s). Published by the American Astronomical Society.
Copyright ©
2025 Astronomy Image Explorer. All Rights Reserved.