Image Details
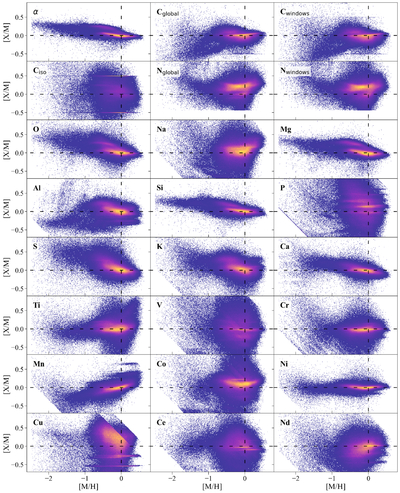
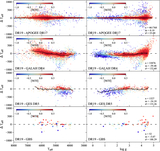
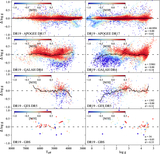
Caption: Figure 14.
Corrected abundances published in DR19 as a function of [M/H] of stars with S/N > 50, no BAD flags, and e_x_h < 0.2. Features seen in the calibrated abundances are discussed in the individual abundance sections. Stripes seen in the low-density regions of some abundances (Na, P, K, V, Cr, Co, Cu, Ce, and Nd) indicate noding problems at low abundance values. All abundances are plotted, except those that are within 0.03 dex of the grid edge. Abundances of Cglobal and Nglobal are from the global fit.
Other Images in This Article
Show More
Copyright and Terms & Conditions
© 2025. The Author(s). Published by the American Astronomical Society.
Copyright ©
2025 Astronomy Image Explorer. All Rights Reserved.