Image Details
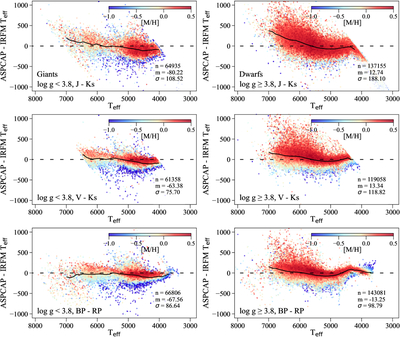
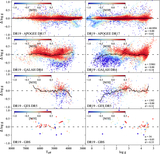
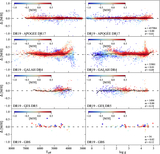
Caption: Figure 3.
Differences of DR19 ASPCAP spectroscopic Teff and IRFM temperatures as a function of ASPCAP Teff color coded by metallicity. The left panels show the giants, and the right panels show the dwarfs. Photometric J − Ks and V − Ks temperatures from J. I. González Hernández & P. Bonifacio (2009) can be seen in the top and middle panels, respectively. The bottom panel shows the differences compared to IRFM temperatures calculated from BP − RP colors (L. Casagrande et al. 2021). The solid black line shows the running median value.
Other Images in This Article
Show More
Copyright and Terms & Conditions
© 2025. The Author(s). Published by the American Astronomical Society.
Copyright ©
2025 Astronomy Image Explorer. All Rights Reserved.