Image Details
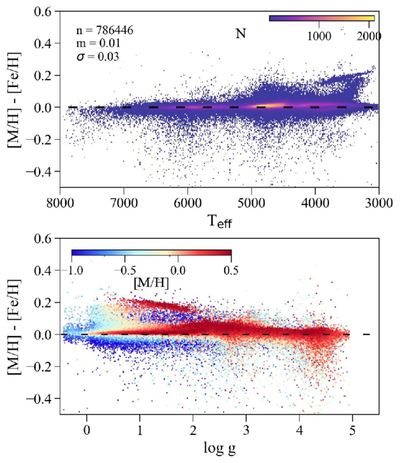
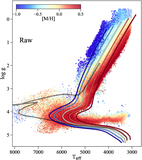
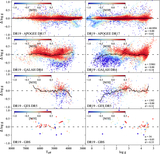
Caption: Figure 9.
Top panel: the 2D histogram of the difference between [M/H] and [Fe/H] as a function of raw Teff. Bottom panel: the difference between [M/H] and [Fe/H] as a function of raw log g color coded by [M/H]. Only stars with S/N > 50 and no bad flags are shown.
Other Images in This Article
Show More
Copyright and Terms & Conditions
© 2025. The Author(s). Published by the American Astronomical Society.
Copyright ©
2025 Astronomy Image Explorer. All Rights Reserved.