Image Details
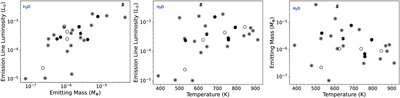
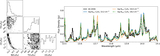
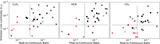
Caption: Figure A2.
Correlations between best-fit parameters retrieved from single-temperature slab model fits to H2O emission lines between 12 and 17.5 μm. Although statistically significant, the correlation between emission-line luminosities and emitting masses (left) is significantly weaker (Spearman ρ = 0.66; p = 10−4) than what is observed for C2H2, HCN, and CO2 (see Figure 8). The single slab temperatures are not correlated with either the emission-line luminosities (middle; Spearman ρ = 0.35; p = 0.064) or emitting masses (right; Spearman ρ = −0.24; p = 0.21).
Other Images in This Article
Show More
Copyright and Terms & Conditions
© 2025. The Author(s). Published by the American Astronomical Society.
Copyright ©
2025 Astronomy Image Explorer. All Rights Reserved.