Image Details
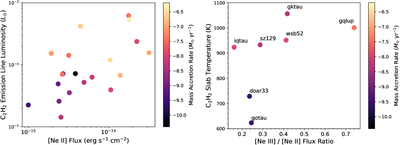
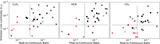
Caption: Figure 19.
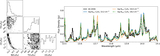
Left panel: C2H2 emission-line luminosities vs. [Ne II] emission-line fluxes. Right panel: C2H2 slab temperatures vs. [Ne III] to [Ne II] flux ratios. In both panels, marker colors represent mass accretion rates (see also, M. J. Colmenares et al. 2024). Upper limits are omitted from the plot and correlation coefficient calculation (see Table 9), due to the large uncertainty in the water removal at 15.555 μm.
Other Images in This Article
Show More
Copyright and Terms & Conditions
© 2025. The Author(s). Published by the American Astronomical Society.
Copyright ©
2025 Astronomy Image Explorer. All Rights Reserved.