Image Details
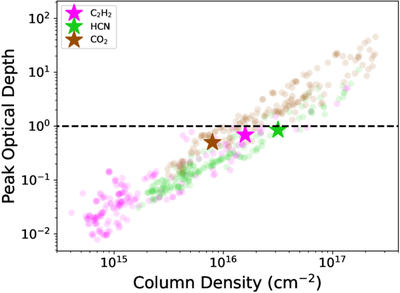
Caption: Figure 15.
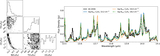
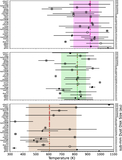
Optical depths vs. column densities for the combinations of C2H2 (magenta), HCN (green), and CO2 (brown) slab model parameters that best reproduce the spectrum of AS 205N; markers with stars correspond to the column densities used in Figure 7, and the black, dashed line shows τ = 1. In general, the C2H2 and HCN slab models are optically thin to larger column densities than the CO2. We note that the 13CO2 Q branch near 15.4 μm is not detected in this target (see, e.g., S. L. Grant et al. 2023; C. Xie et al. 2023; C. Salyk et al. 2025), or the 13C12CH2 Q branch seen in DoAr 33 and GO Tau (B. Tabone et al. 2023; A. M. Arabhavi et al. 2024; M. J. Colmenares et al. 2024; J. Kanwar et al. 2024a).
Other Images in This Article
Show More
Copyright and Terms & Conditions
© 2025. The Author(s). Published by the American Astronomical Society.