Image Details
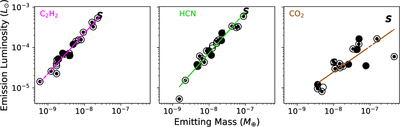
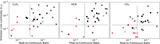
Caption: Figure 13.
Median emission-line luminosities from C2H2 (left), HCN (middle), and CO2 (right) vs. the median emitting masses measured from the best-fit slab models for each disk, with marker styles indicating the submillimeter dust substructures listed in Table 2. We report statistically significant, positive correlations and linear relationships between the two parameters for all three molecules (see Equation (1)), implying that the emission is optically thin to moderately optically thick (Spearman ρ = 0.97, 0.98, 0.82).
Other Images in This Article
Show More
Copyright and Terms & Conditions
© 2025. The Author(s). Published by the American Astronomical Society.
Copyright ©
2025 Astronomy Image Explorer. All Rights Reserved.