Image Details
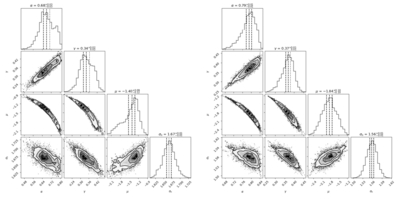
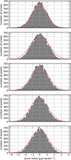
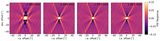
Caption: Figure 15.
The posterior probability distributions of the four model parameters such as α, γ, μ, and σ0 are presented in 2D corner plots for models with an input pixel-value range of [−10, +10] in the left and [−60, +60] μJy beam−1 in the right panel, respectively.
Other Images in This Article
Show More
Copyright and Terms & Conditions
© 2025. The Author(s). Published by the American Astronomical Society.
Copyright ©
2025 Astronomy Image Explorer. All Rights Reserved.