Image Details
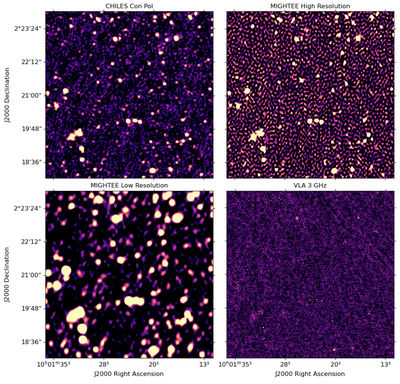
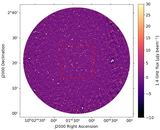
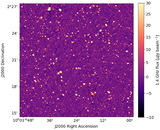
Caption: Figure 8.
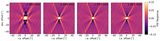
The total intensity radio continuum images of a ﹩3^{\prime} \rm{}\,\rm{}\,\times 3^{\prime} \rm{}\,\rm{}\,﹩ region for a detailed comparison among the CHILES Con Pol (top left), MIGHTEE high (θ = 5″; upper right) and low resolution (θ = 8″. 6; lower left I. Heywood et al. 2022), and VLA-COSMOS 3 GHz (θ = 0﹩\mathop{.}\limits^{\unicode{x02033}}﹩75; lower right V. Smolčić et al. 2017) data. The intensity ranges shown are between −1 and +20 μJy for the first three panels and −1 and +10 μJy for the VLA-COSMOS 3 GHz image. The VLA-COSMOS 1.4 GHz survey data (E. Schinnerer et al. 2007) is too shallow (σ ≈ 10 μJy) to offer a meaningful comparison and is not shown.
Other Images in This Article
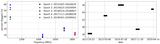
Show More
Copyright and Terms & Conditions
© 2025. The Author(s). Published by the American Astronomical Society.