Image Details
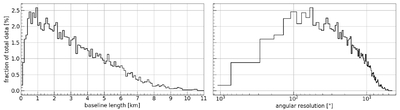
Caption: Figure 2.
Left: The percentages of total visibilities as a function of baseline length, with the data put into bins of width 100 m. Right: The percentages of total visibilities, using the same bins as the plot to the left, as a function of the angular scale to which they are sensitive to emission.
Other Images in This Article
Show More
Copyright and Terms & Conditions
© 2025. The Author(s). Published by the American Astronomical Society.
Copyright ©
2025 Astronomy Image Explorer. All Rights Reserved.