Image Details
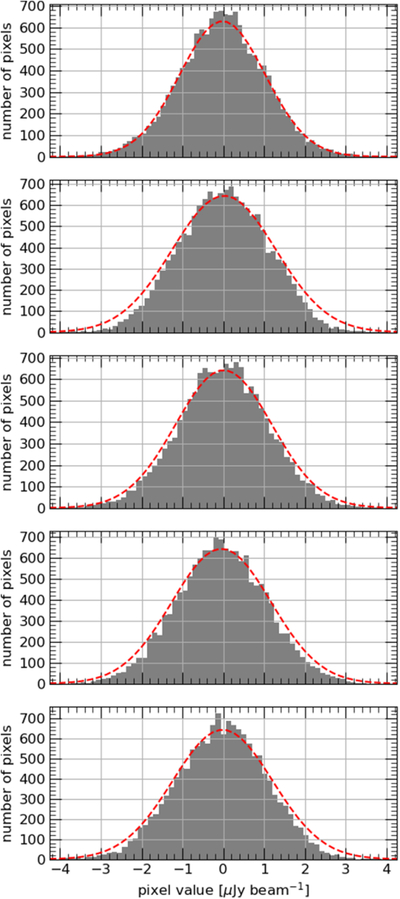
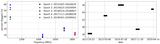
Caption: Figure 7.
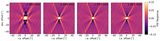
The distribution of pixel values for the total intensity image over five blank sky regions 39′, 44′, 48′, 49′, and 57′ away from the phase center (shown here in descending plots) with sizes of 3﹩^{\prime} ﹩ × 3﹩^{\prime} ﹩. The distributions are shown for the range ±4 μJy beam−1 range with the bin size dictated by the Freedman–Diaconis rule. The red-dashed lines indicate the Gaussian fits to the distributions used in estimating the rms noise.
Other Images in This Article
Show More
Copyright and Terms & Conditions
© 2025. The Author(s). Published by the American Astronomical Society.
Copyright ©
2025 Astronomy Image Explorer. All Rights Reserved.