Image Details
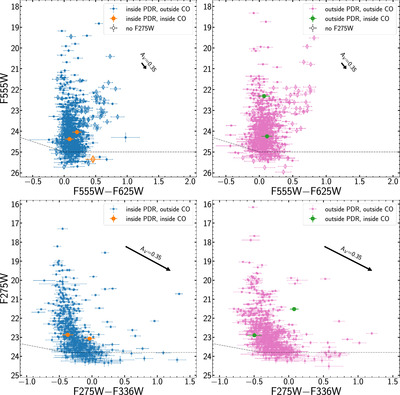
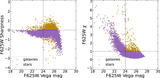
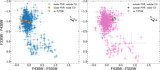
Caption: Figure 5.
Top left: F555W vs. F555W–F625W color–magnitude diagram (CMD) for stars inside the PDR and outside the CO cores (blue) and stars inside the PDR and projected inside the CO cores (orange). Top right: F555W vs. F555W–F625W CMD for stars outside the PDR and outside the CO cores (pink) and stars outside the PDR and projected inside the CO cores (green). Bottom left: F275W vs. F275W–F6336W CMD for stars inside the PDR and outside the CO cores (blue) and stars inside the PDR and projected inside the CO cores (orange). Bottom right: F275W vs. F275W–F336W CMD for stars outside the PDR and outside the CO cores (pink) and stars outside the PDR and projected inside the CO cores (green). Stars detected in all filters are represented by circles (∘), while stars that were not detected in the F275W filter are represented by diamonds (♢). The black arrow in each plot shows the reddening vector for AV = 0.35, the mean AV of stars in WLM measured by Y. Wang et al. (2022), assuming SMC-like extinction. The error bars in the upper-left corner of each plot demonstrate the mean uncertainty associated with the data shown. The gray dashed line shows the 5σ point-source detection limit for the given filters and exposure times (R. A. Windhorst et al. 2022).
Other Images in This Article
Show More
Copyright and Terms & Conditions
© 2025. The Author(s). Published by the American Astronomical Society.