Image Details
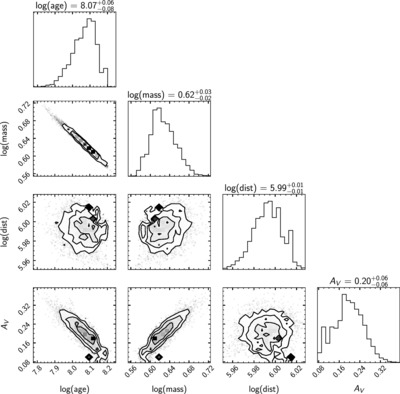
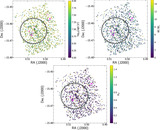
Caption: Figure 10.
Corner plot of samples drawn from the posterior distribution for Star 1 in Table 11 of stars inside the PDR and projected inside the CO cores demonstrating the degeneracies between mass, age, distance, and dust.
Other Images in This Article
Show More
Copyright and Terms & Conditions
© 2025. The Author(s). Published by the American Astronomical Society.
Copyright ©
2026 Astronomy Image Explorer. All Rights Reserved.