Image Details
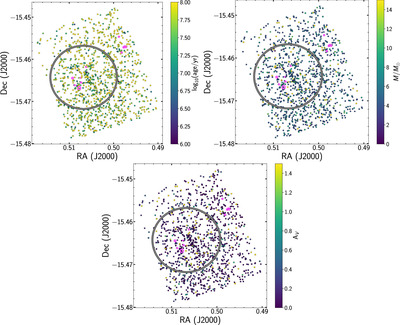
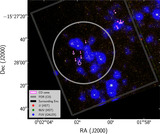
Caption: Figure 8.
Plots showing the spatial distribution of stars, color-coded by their ages (top left), masses (top right), and AV (bottom). The large gray circle demarcates the PDR, while the smaller magenta circles show the locations and sizes of the CO cores.
Other Images in This Article
Show More
Copyright and Terms & Conditions
© 2025. The Author(s). Published by the American Astronomical Society.
Copyright ©
2026 Astronomy Image Explorer. All Rights Reserved.