Image Details
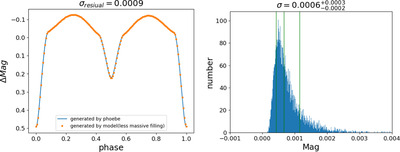
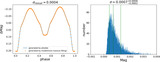
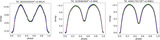
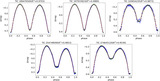
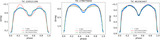
Caption: Figure 3.
The blue light curve on the left was synthesized by PHOEBE, whereas the model (less massive filling), using the same input parameters, produced the orange curve. Meanwhile, the distribution shown on the right illustrates the standard deviation of the residuals between the model’s predicted light curves and PHOEBE’s synthetic curves.
Other Images in This Article
Copyright and Terms & Conditions
© 2025. The Author(s). Published by the American Astronomical Society.
Copyright ©
2026 Astronomy Image Explorer. All Rights Reserved.