Image Details
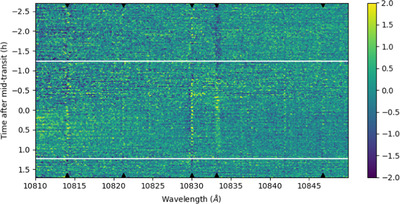
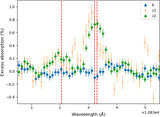
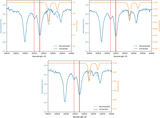
Caption: Figure 9.
“Residuals grid” for visit c2. The colors represent deviations, in percent, from the time-averaged mean flux at that wavelength (lower flux is yellower). The black triangles indicate the lines that we masked out before fitting a quadratic function to each row, which in turn was done to remove continuum variations.
Other Images in This Article
Copyright and Terms & Conditions
© 2025. The Author(s). Published by the American Astronomical Society.
Copyright ©
2026 Astronomy Image Explorer. All Rights Reserved.