Image Details
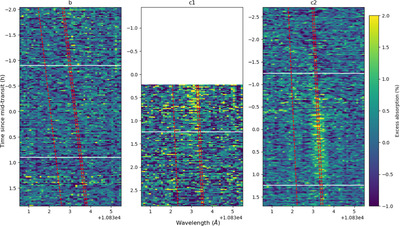
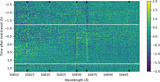
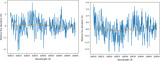
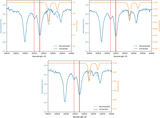
Caption: Figure 3.
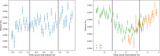
Excess absorption as a function of time and wavelength in the stellar frame, for planets b (left) and c (center and right). The top and bottom white lines represent white-light ingress and egress, while the slanted red lines indicate the wavelengths of the helium triplet in the planetary frame. The data behind this figure are available in six ASCII data files. A Python script is provided to read these files and recreate the figure.
(The data used to create this figure are available in the online article.)
(The data used to create this figure are available.)
Other Images in This Article
Copyright and Terms & Conditions
© 2025. The Author(s). Published by the American Astronomical Society.
Copyright ©
2026 Astronomy Image Explorer. All Rights Reserved.