Image Details
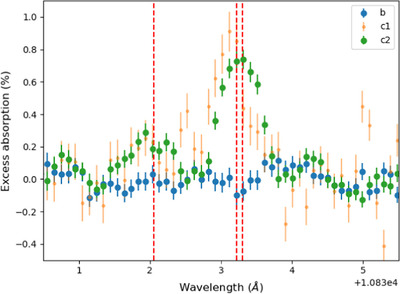
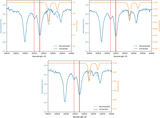
Caption: Figure 4.
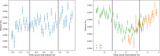
Average in-transit excess absorption in the planetary frame for all three visits. The error bars are underestimated because they only include the photon noise, read noise, and flat-fielding error, not systematics. Visits b and c2 are directly comparable because they both include a full transit and baseline on both sides, but c1 is not directly comparable because it is a partial transit. The data behind this figure are available in machine-readable format.
(The data used to create this figure are available in the online article.)
(The data used to create this figure are available.)
Other Images in This Article
Copyright and Terms & Conditions
© 2025. The Author(s). Published by the American Astronomical Society.
Copyright ©
2026 Astronomy Image Explorer. All Rights Reserved.