Image Details
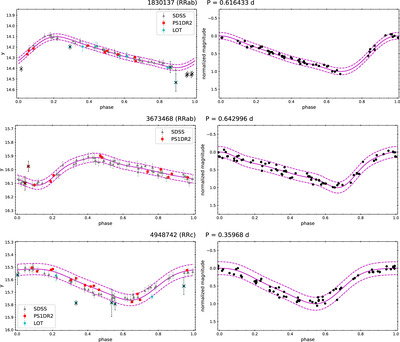
Caption: Figure 2.
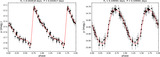
Examples of the y-band light curves for two RRab and one RRc stars. The observed light curves are presented in the left panels, where the crosses are rejected data points (see text for more details). The solid magenta curves are the best-fit Fourier expansion, and the dashed magenta curves represent the ±2σ boundaries. The right panels show the corresponding normalized light curves, which have been shifted such that the maximum light located at (0, 0).
Other Images in This Article
Copyright and Terms & Conditions
© 2025. The Author(s). Published by the American Astronomical Society.
Copyright ©
2026 Astronomy Image Explorer. All Rights Reserved.