Image Details
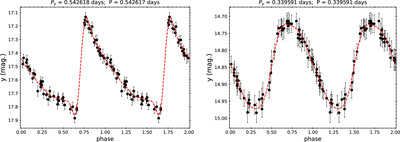
Caption: Figure 5.
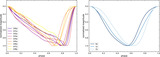
Fitting of the y-band template light curves (red dashed curves) to two randomly selected RRab (left panel) and RRc (right panel) stars with gatspy. The black points are the transformed SDSS light curve data (see Section 2) for these two RR Lyrae. Periods found by using the y-band templates (Py) are in good agreement with the periods given in B. Sesar et al. (2010).
Other Images in This Article
Copyright and Terms & Conditions
© 2025. The Author(s). Published by the American Astronomical Society.
Copyright ©
2026 Astronomy Image Explorer. All Rights Reserved.