Image Details
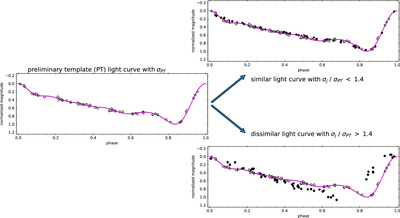
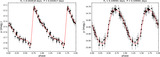
Caption: Figure 3.
Illustration of selecting a pair of similar light curves. A light curve was selected from a list of RR Lyrae (usually the one with the smallest σ) as the preliminary template (PT) light curve, which has a light curve dispersion of σPT. This PT is shown in the left panel, where the magenta curve is the best-fit light curve to the data points for this RR Lyrae (open circles). The best-fit light curve (the same magenta curve on the left panel) was then used to fit the jth observed light curve in the list, represented as filled circles in the right panels, and the light curve dispersion σj was calculated from the fitting. The top-right panel shows an example of the jth light curve which is similar to the PT light curve, which satisfied σj/σPT < 1.4. In contrast, the bottom-right panel is an example of the jth light curve that is not similar to the PT light curve. Note that the magenta curves and the open circles in the right panels are same as those in the left panel (i.e., the PT light curve).
Other Images in This Article
Copyright and Terms & Conditions
© 2025. The Author(s). Published by the American Astronomical Society.