Image Details
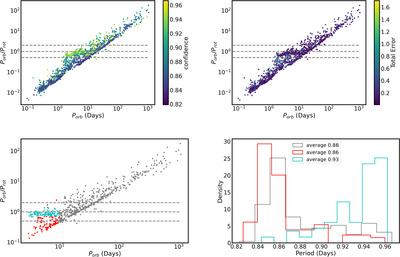
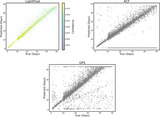
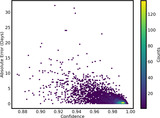
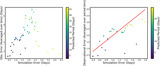
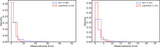
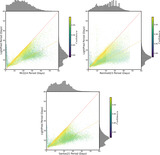
Caption: Figure 16.
EBs orbital period vs. the ratio between orbital period and rotational period. Horizontal lines corresponds to Porb/Prot = 0.5, 1, 2. In the upper-left panel, colors correspond to the model's confidence. In the upper-right panel, colors correspond to the total error. The lower-left panel shows the three classes defined in Section 5.2.4. The lower-right panel shows the histograms of confidence for the classes on the left panel.
Other Images in This Article
Show More
Copyright and Terms & Conditions
© 2025. The Author(s). Published by the American Astronomical Society.
Copyright ©
2025 Astronomy Image Explorer. All Rights Reserved.