Image Details
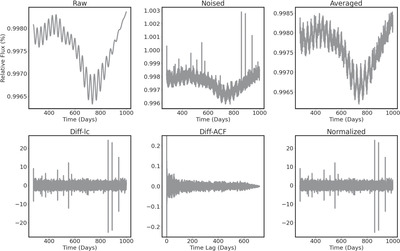
Caption: Figure 1.
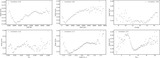
Example of a simulated light curve and the different preprocessing stages. The stages are shown sequentially from the upper left to the lower right. The upper-left panel shows the raw light curve, randomly cropped to the 720 day segment. The upper-middle panel shows the light curve after the addition of Kepler noise, and the upper-right panel shows the resulting light curve after averaging with a 6 hr window. The lower-left panel shows the light-curve differences (Diff-Lc), and the lower-middle panel shows the resulting normalized Diff-ACF. The lower-right panel shows the normalized differences light curve. The input for the model is a two-channel time series corresponding to the last two panels.
Other Images in This Article
Show More
Copyright and Terms & Conditions
© 2025. The Author(s). Published by the American Astronomical Society.