Image Details
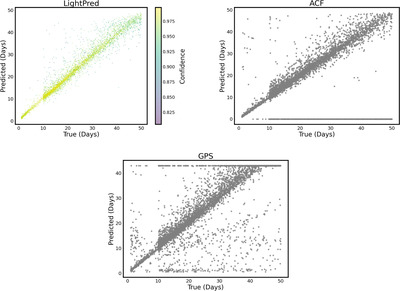
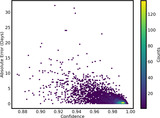
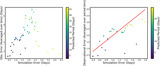
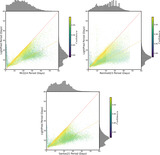
Caption: Figure 4.
Results of our model (upper left) vs. implementations of ACF (upper right) and GPS (lower) on our test data set. In the left panel, the color represents the model's confidence levels. The sharp drop of samples, seen at 10 days, is a result of the prior distribution of periods (see Table 1). This distribution was also implemented in S. Aigrain et al. (2015) and motivated by the bimodality found by A. McQuillan et al. (2013; 2014).
Other Images in This Article
Show More
Copyright and Terms & Conditions
© 2025. The Author(s). Published by the American Astronomical Society.
Copyright ©
2025 Astronomy Image Explorer. All Rights Reserved.