Image Details

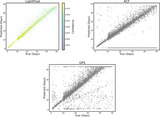
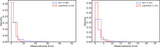
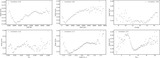
Caption: Figure 7.
Simulation error vs. observational error (averaged over 1 day bin). The left panel shows all of the samples, and the right panel shows only samples with predicted periods smaller than 25 days. The red line represents a line with a slope of 2.
Other Images in This Article
Show More
Copyright and Terms & Conditions
© 2025. The Author(s). Published by the American Astronomical Society.
Copyright ©
2025 Astronomy Image Explorer. All Rights Reserved.