Image Details
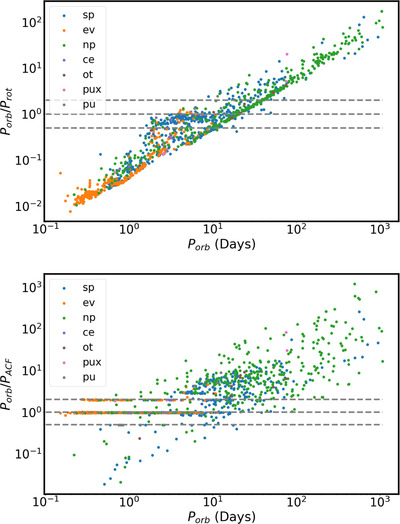
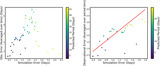
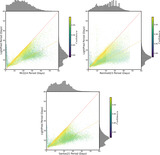
Caption: Figure 15.
EBs orbital period vs. the ratio between the orbital period and stellar period. Horizontal lines corresponds to Porb/Prot = 0.5, 1, 2. The upper panel shows the stellar period predicted by LightPred, and the lower panel shows the stellar period predicted by the ACF method. The colors represent stellar classes defined by J. C. Lurie et al. (2017)—sp—starspots modulation; ev—Ellipsoidal variations; np—no periodic out-of-eclipse variability; ce—Targets where starspot modulations appear to have been mistaken for ellipsoidal variation; ot—another periodic out-of-eclipse variability; pux—possible pulsator; pu—likely pulsator.
Other Images in This Article
Show More
Copyright and Terms & Conditions
© 2025. The Author(s). Published by the American Astronomical Society.