Image Details
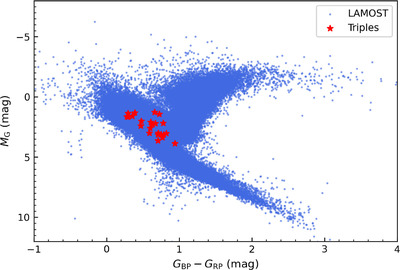
Caption: Figure 2.
The color–magnitude graph of 23 triple-star systems (red stars) determined from Gaia DR3 and LAMOST (blue dots). The x-axis shows the color difference between GBP and GRP, and the y-axis displays the absolute magnitudes MG. All photometric data are from Gaia DR3.
Other Images in This Article
Show More
Copyright and Terms & Conditions
© 2025. The Author(s). Published by the American Astronomical Society.
Copyright ©
2026 Astronomy Image Explorer. All Rights Reserved.