Image Details
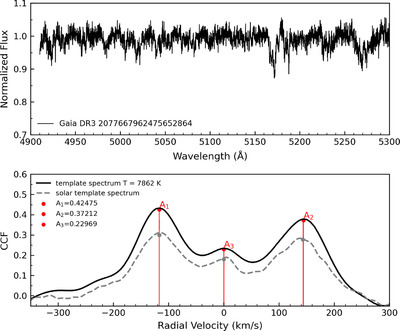
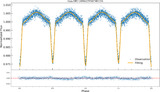
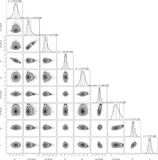
Caption: Figure 1.
Comparison of the CCF peak values for Gaia DR3 2077667962475652864 using different template spectra. In the upper part of the figure shows the normalized spectra. In the lower part of the figure, we present the generated CCF, A1 = 0.53, V1 = −131 km s−1, A2 = 0.48, V2 = 134 km s−1, and A3 = 0.41, V3 = 19 km s−1. The black solid line represents a template spectrum with a temperature of 7862 K, while the gray dashed line represents a CCF generated using a conventional solar spectrum template.
Other Images in This Article
Show More
Copyright and Terms & Conditions
© 2025. The Author(s). Published by the American Astronomical Society.
Copyright ©
2026 Astronomy Image Explorer. All Rights Reserved.