Image Details
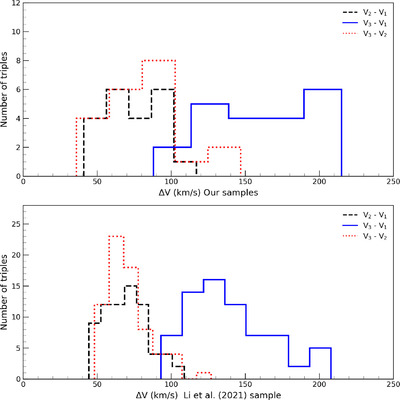
Caption: Figure 6.
Distribution of the number of ΔVs between any two components in the triples. The three velocities, ordered from lowest to highest, are labeled as V1, V2, and V3. The upper panel shows the ΔV distribution between any two components of the triple-star sample from Section 3, while the lower panel shows the same for the 132 triple-star candidates from C. Li et al. (2021). The black dashed line denotes ΔV between V2 − V1 (ΔV2−1), the red dashed–dotted line shows ΔV between V3 − V2 (ΔV3−2), and the blue solid line indicates ΔV between V3 − V1 (ΔV3−1).
Other Images in This Article
Show More
Copyright and Terms & Conditions
© 2025. The Author(s). Published by the American Astronomical Society.
Copyright ©
2026 Astronomy Image Explorer. All Rights Reserved.