Image Details
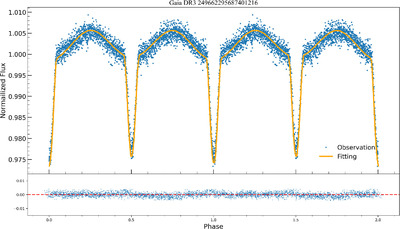
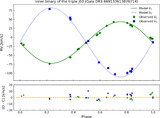
Caption: Figure 5.
Light curve fitting for the triple-star system Gaia DR3 249662295687401216. The blue dots indicate phase-folded observations, and the solid yellow line indicates the results of the fit. The horizontal axis indicates the phase, and the fitting residuals are shown at the bottom of the plot.
Other Images in This Article
Show More
Copyright and Terms & Conditions
© 2025. The Author(s). Published by the American Astronomical Society.
Copyright ©
2026 Astronomy Image Explorer. All Rights Reserved.