Image Details
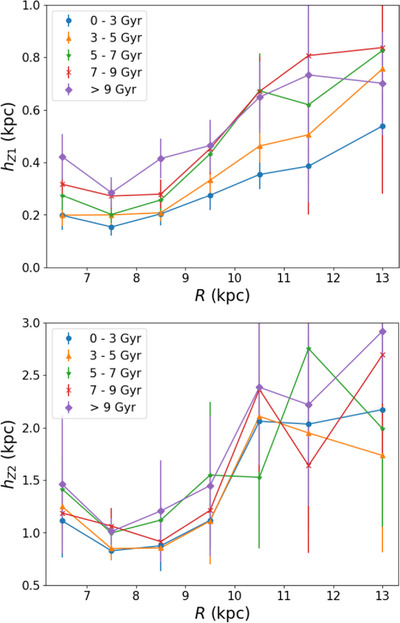
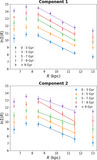
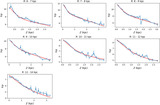
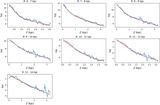
Caption: Figure 5.
Vertical scale height profiles for various mono-age populations. Error bars indicate 1σ uncertainty. The top and bottom panels show the radial dependencies of hZ1 and hZ2, respectively, for different age groups, as indicated.
Other Images in This Article
Show More
Copyright and Terms & Conditions
© 2025. The Author(s). Published by the American Astronomical Society.
Copyright ©
2026 Astronomy Image Explorer. All Rights Reserved.