Image Details
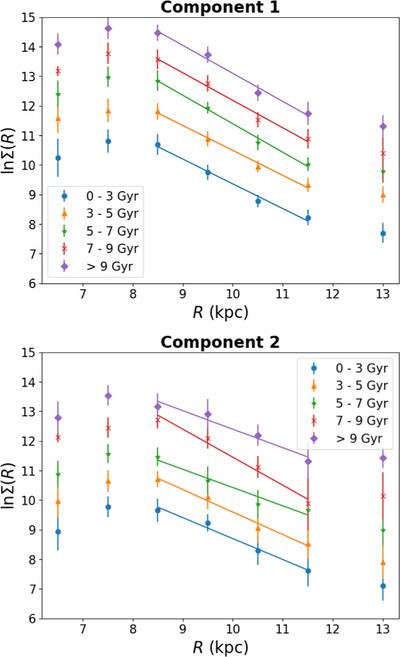
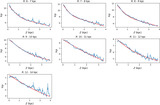
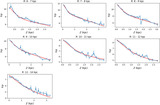
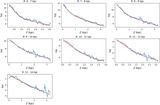
Caption: Figure 6.
Radial surface density profiles Σ(R) for the five mono-age populations. Different populations are offset vertically for clarity. The top panel highlights Component 1, while the bottom panel focuses on Component 2. Each point represents the natural logarithm of surface densities across different radial segments. The fitting results are shown as solid lines in the figure.
Other Images in This Article
Show More
Copyright and Terms & Conditions
© 2025. The Author(s). Published by the American Astronomical Society.
Copyright ©
2026 Astronomy Image Explorer. All Rights Reserved.