Image Details
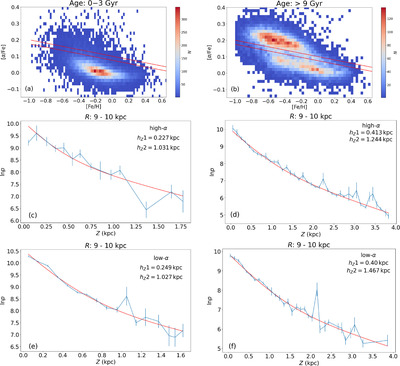
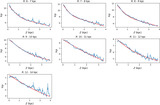
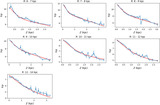
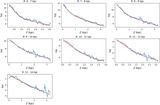
Caption: Figure 7.
[Fe/H]–[α/Fe] distributions for our RC sample stars across two age populations: 0–3 Gyr (left column) and >9 Gyr (right column). The red demarcations in panels (a) and (b) distinguish the chemical thin and thick disk stars. Panels (c) and (e) respectively depict double exponential fits for high- and low-α sequences of the 0–3 Gyr population within the 9 < R < 10 kpc range. Similarly, panels (d) and (f), respectively, present double exponential fits for high- and low-α sequences of the >9 Gyr population.
Other Images in This Article
Show More
Copyright and Terms & Conditions
© 2025. The Author(s). Published by the American Astronomical Society.
Copyright ©
2026 Astronomy Image Explorer. All Rights Reserved.