Image Details
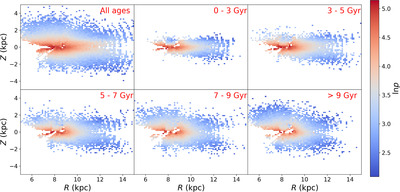
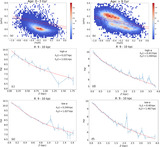
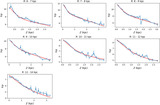
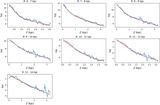
Caption: Figure 3.
Distribution of stellar number density in the disk R–Z plane for different mono-age populations, indicated in the upper right corner of each panel. The density map uses a bin size of 0.125 × 0.125 kpc. Each panel represents a distinct age group, with density variations shown through a color gradient from blue (low density) to red (high density).
Other Images in This Article
Show More
Copyright and Terms & Conditions
© 2025. The Author(s). Published by the American Astronomical Society.
Copyright ©
2026 Astronomy Image Explorer. All Rights Reserved.