Image Details
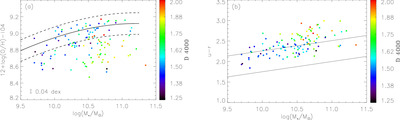
Caption: Figure 5.
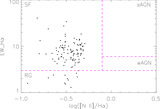
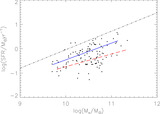
12 + log(O/H) and u − r color vs. the stellar mass with the color bar of D n 4000. Left panel: the stellar mass vs. 12 + log(O/H). The black solid and dashed curves represent the MZ relation and its 1σ scatter of C. A. Tremonti et al. (2004). Right panel: the stellar mass vs. u − r color. The location of the green valley galaxies is indicated with the two solid lines (K. Schawinski et al. 2014).
Other Images in This Article
Copyright and Terms & Conditions
© 2024. The Author(s). Published by the American Astronomical Society.
Copyright ©
2026 Astronomy Image Explorer. All Rights Reserved.