Image Details
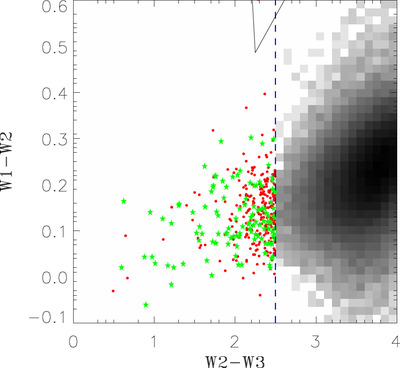
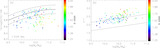
Caption: Figure 1.
W2 − W3 vs. W1 − W2 diagnostic diagram. Black squares represent the galaxy sample with SF; red dots indicate galaxies without SF; and green pentagrams are confirmed ETGs. The blue dashed line on this diagram demarcates the best boundary between galaxies with and without ongoing SF. The black lines delineate the “AGN” wedge, as proposed by S. Mateos et al. (2012).
Other Images in This Article
Copyright and Terms & Conditions
© 2024. The Author(s). Published by the American Astronomical Society.
Copyright ©
2026 Astronomy Image Explorer. All Rights Reserved.