Image Details
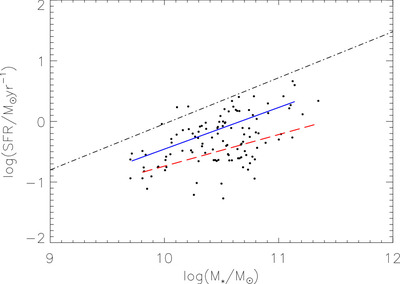
Caption: Figure 7.
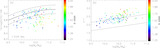
Diagram of the stellar mass and SFR for our ETG sample. The black dotted–dashed line represents the best fit to the SDSS data (A. Renzini & Y.-J. Peng 2015). The blue solid and red dashed lines exhibit the best least-squares fits for the two samples, with the fits located within the 1σ region and below the 2σ level of the MZ relation.
Other Images in This Article
Copyright and Terms & Conditions
© 2024. The Author(s). Published by the American Astronomical Society.
Copyright ©
2026 Astronomy Image Explorer. All Rights Reserved.