Image Details
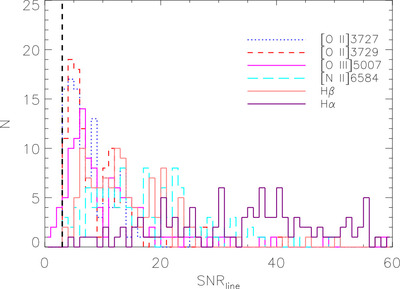
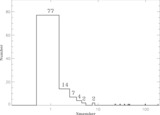
Caption: Figure 3.
The distributions of SNRs for various emission lines. The different colors and line types represent SNRs corresponding to different emission lines within our sample. The thick black dashed line shows the SNR > 3 of various lines.
Other Images in This Article
Copyright and Terms & Conditions
© 2024. The Author(s). Published by the American Astronomical Society.
Copyright ©
2026 Astronomy Image Explorer. All Rights Reserved.